Pivot tables
Pivot tables are a convenient way of clearly displaying and analyzing data from lists. They allow information to be grouped and summarized based on various criteria. A list can contain several pivot tables, each of which offers different perspectives of the data. When you save a list, the respective pivot tables are also saved.
The basis for the pivot display is a so-called cross table. This arranges the data in rows and columns and lets you perform various calculations at the intersections of the table, such as the quantity, the sum or the average.
Example cross table
| Female | Male | Total | |
|---|---|---|---|
| Article A | 200 | 300 | 500 |
| Article B | 220 | 250 | 470 |
| Article C | 130 | 350 | 480 |
| Article D | 420 | 120 | 540 |
| Summe | 970 | 1020 | 1990 |
The table shown here shows the number of sales grouped by article and gender. The fields are divided into row, column and result fields. The number is then determined in the result fields.
Pivot tables can be used to carry out comprehensive analyses within Uniplex. This provides direct access to the most up-to-date data in the data inventory and reduces exports to other systems to a minimum.
You need a preconfigured list for a pivot analysis; a simple, single-row list or a preconfigured portal is all you need as a starting point. All the information required for the pivot table must therefore be available in one row of this list. Both data from the existing records and computed fields can be used.
Calling up a pivot table
- go to list definitions using the list menu in the record type overview.
There, click the button Load list definitions
 and select your desired list definition.
 -
using the search field
-
open a portal, open a group using the portal list and select the desired list definition
From each of these list definitions, you can access the selection menu ![]() with several selection options. Select
with several selection options. Select ![]() Open pivot view.
Open pivot view.
Important
If you have a big data inventory, not all data will be uploaded. Only the values in your pivot table that are currently shown are calculated. If you want to have all data visible, you need to activate Load data ![]() either in the upper or lower area of the tab.
either in the upper or lower area of the tab.
List view
Pivot list view with short description
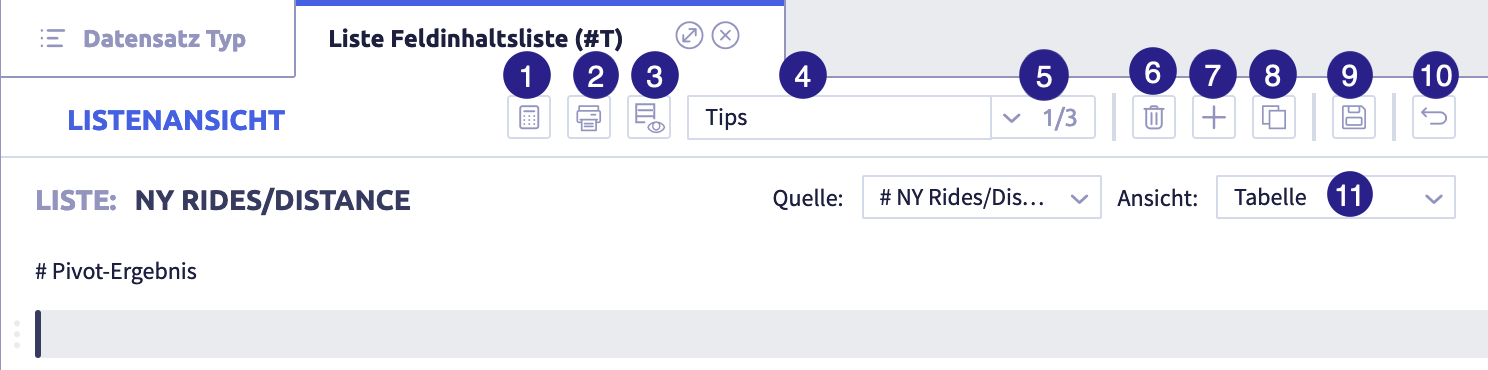
- recalculate pivot table: click this button once the configuration is complete
- print pivot table: creates a PDF from the configured table
- opens the pivot settings for configuring the fields - when activated, the button changes to
 close pivot settings
 - input field for the name of the pivot table
- pivot list from which you can select from various pivot tables, if available.
- delete the current pivot table
- create a new pivot table
- create a copy of the current pivot table (will then appear under consecutive numbering in 4. and should be renamed accordingly)
- save pivot table, including configuration and all changes
- close pivot view
- table view: selection between two views possible
Creating a pivot table from a list definition
You are in your selected list view and the pivot view is open.
- click on New pivot table
 and assign a name
 -
activate
Add field and define a row field and a data field as a minimum requirementColumn fields can be defined optionally.
-
start the calculation with the button Recalculate pivot table

Info
The button Recalculate pivot table ![]() only displays your pivot table; you should always save it using the button Save
only displays your pivot table; you should always save it using the button Save ![]() .
.
Edit fields
- to edit a row, column or data field, click the button Edit

- save your edits with the button Save

- you will find advanced options for changing the font color and font size if you select the Adjust style checkbox.
Any changes you make here are displayed with the button Recalculate pivot table ![]() !
Save the changes with the button Save
!
Save the changes with the button Save ![]() .
.
-
for further editing, select the button Edit
 in the list view and continue as described above
Further editing

-
to add another field, click the button Add
Various functions are available for determining the result for the data fields. You can select whether you want to calculate the number and the number of different contents, the sum, the minimum and maximum or the mean value.
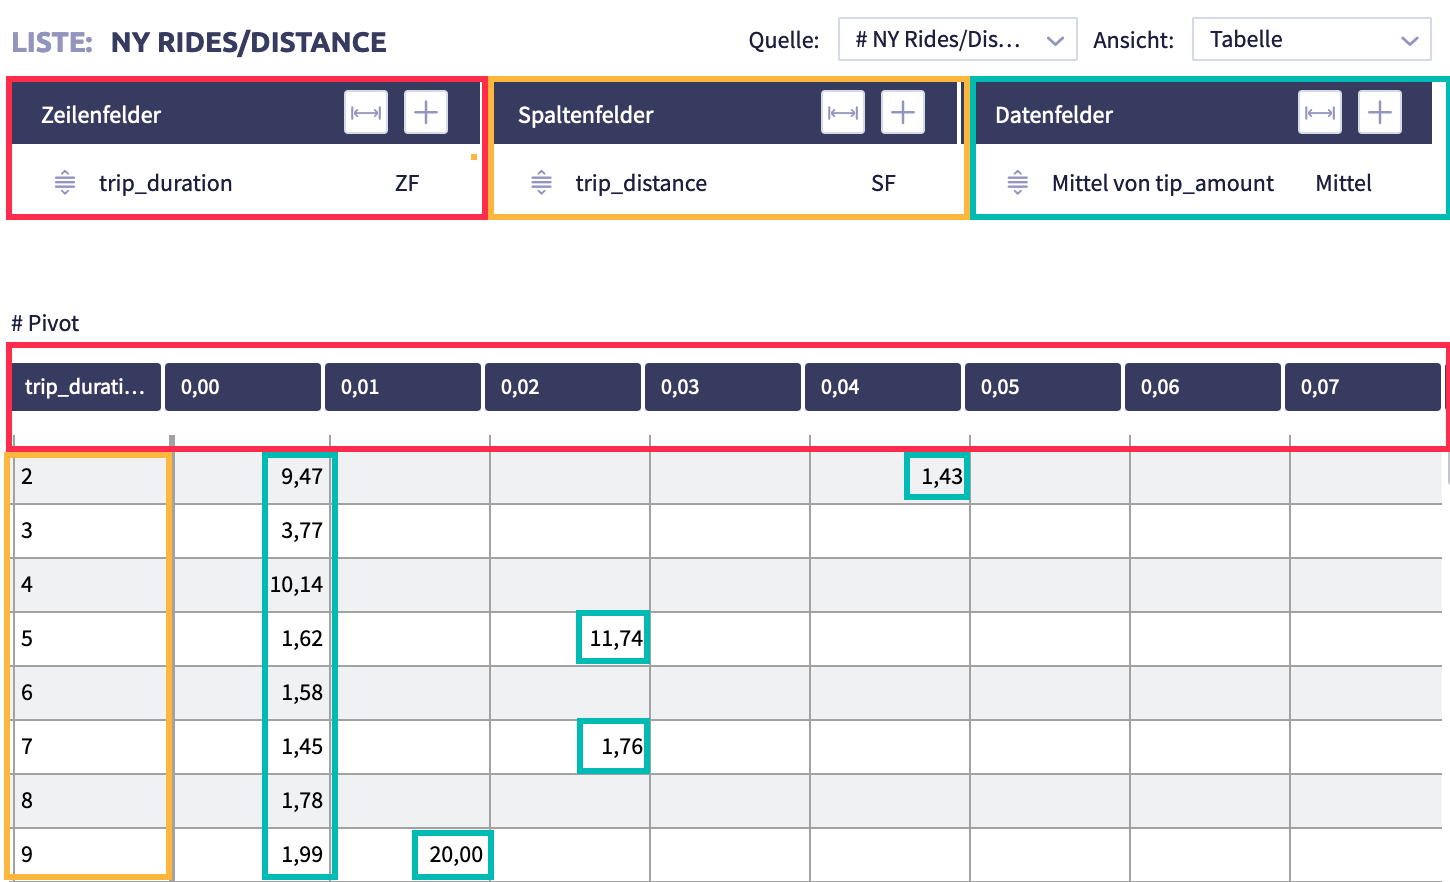
Image: the colored markings show where the information from the configuration is displayed
Pivot lists
When you open the pivot view, the previously saved view is displayed. If no pivot view has been saved for the list view, the display is empty and you can create a new configuration.
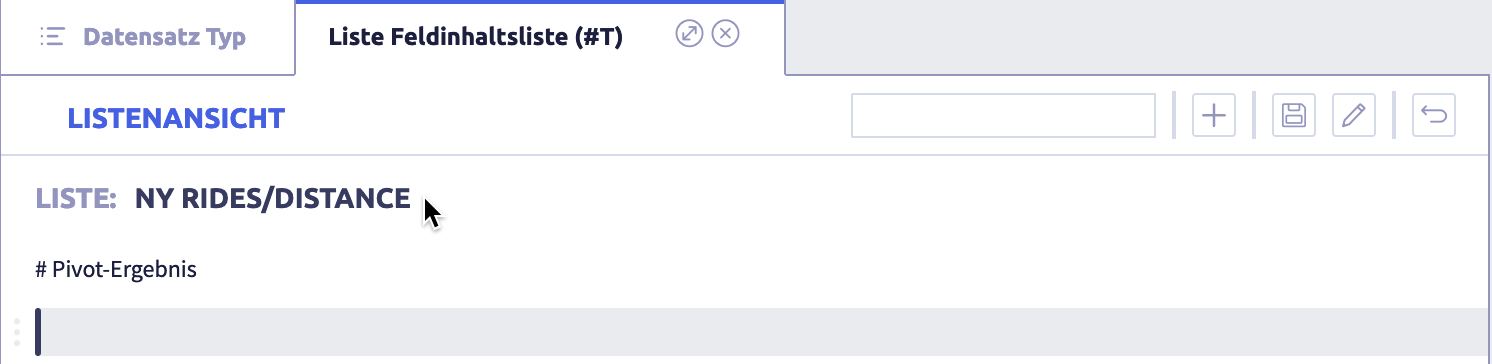
The image shows the list view without pivot view
If you want to call up a previously saved pivot table, you will see the following view:
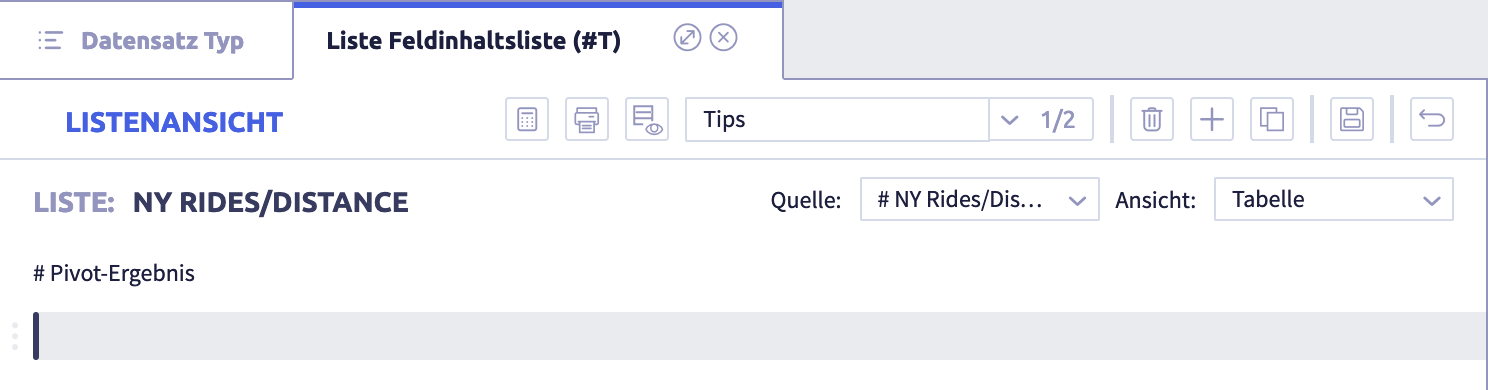
The image shows the list view with pivot view
After clicking the arrow symbol ![]() , the view expands with a drop-down menu from which you can select the desired pivot table:
, the view expands with a drop-down menu from which you can select the desired pivot table:
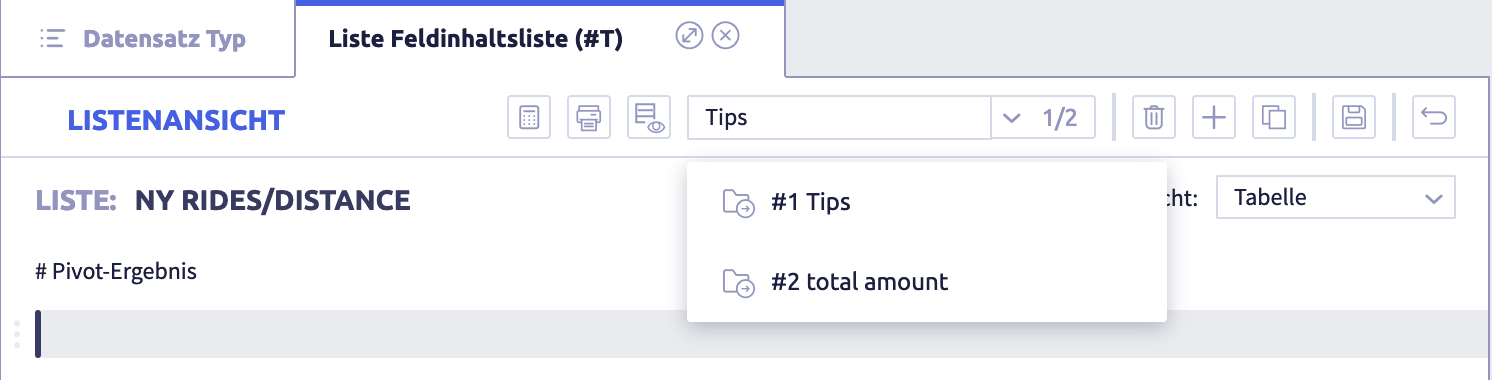
The image shows the list view with dropdown
- select the desired pivot table from this list with the button Load list definitions
- call up the result by clicking on the button Recalculate pivot table
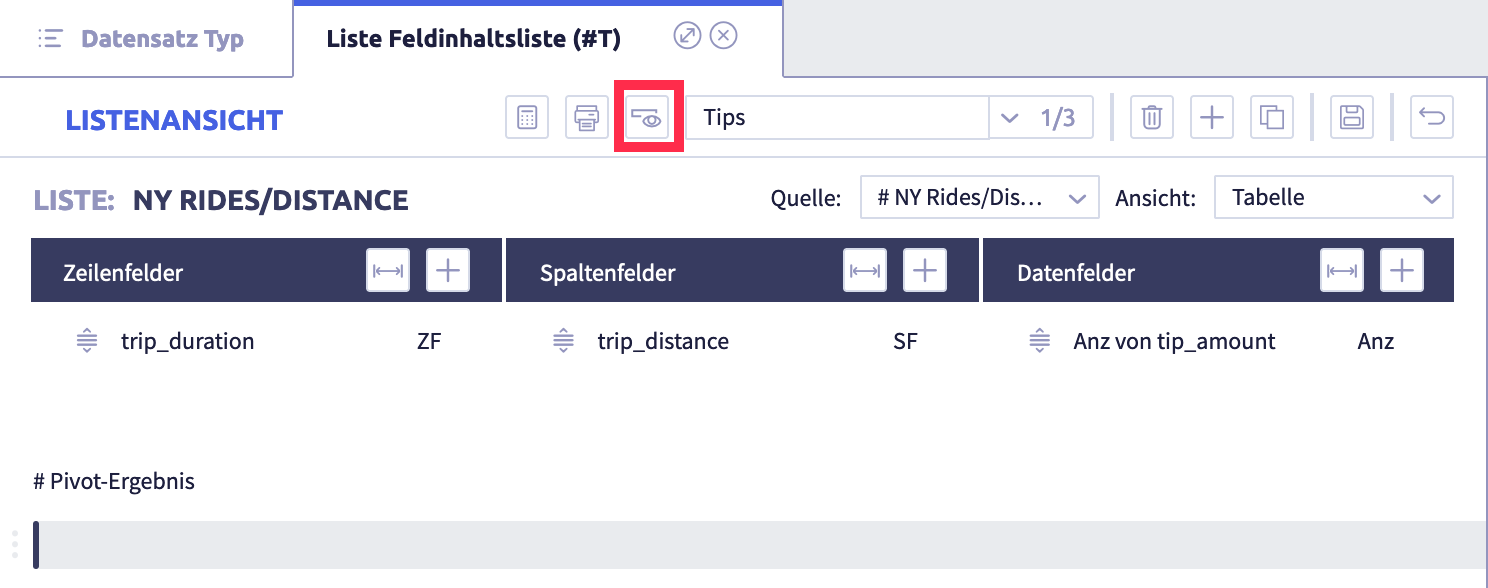
- by clicking the button Open pivot settings
 , you can see the configuration of the fields in the pivot table
 -
this display can be hidden again with the button Close pivot settings
Fields
Tip
You can configure several pivot tables for each list. A meaningful name should therefore be used for each one.
View of the pivot table
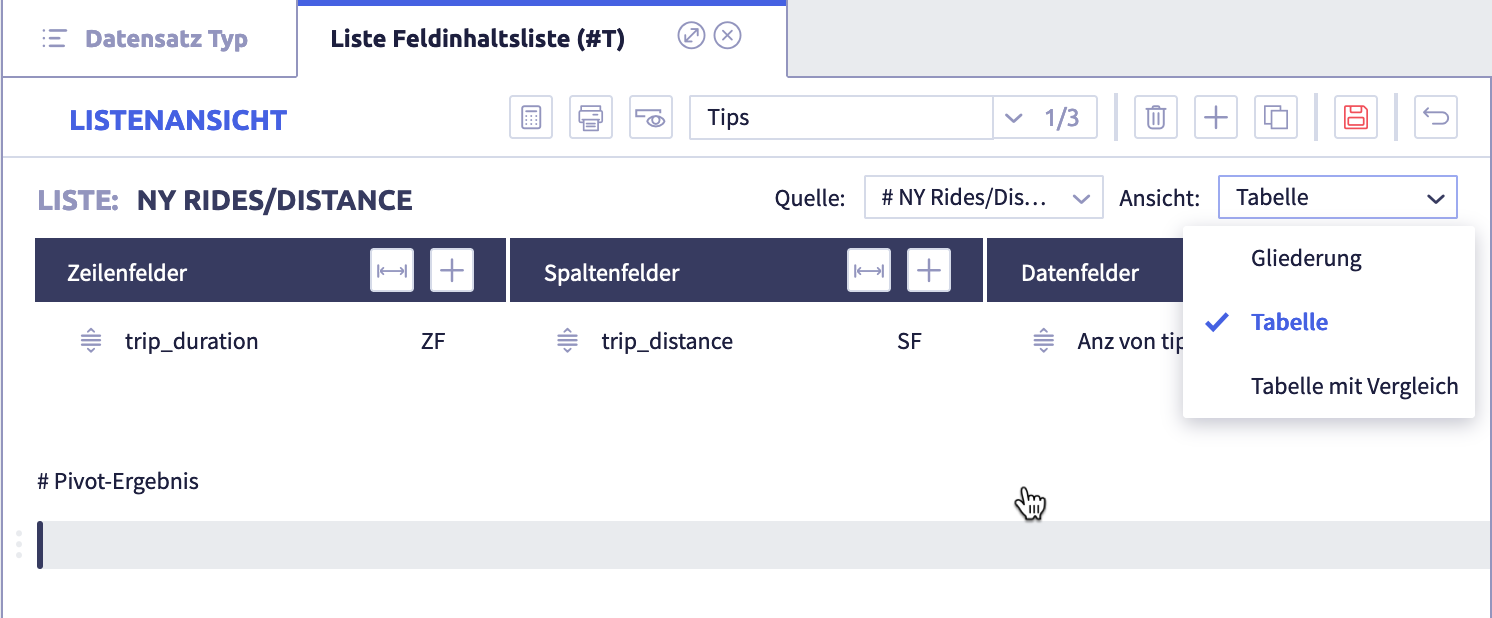
You can view your pivot table in two different views.
- Table is the usual display of a pivot table
- Outline groups the values per row field, the total results are displayed for each grouping.
Dashboards can only be configured on the basis of the view Table